qStorm
Prices options from a forecast of an asset's return distribution, with no calibration to option quotes. The forecast's skew and fat tails become the volatility smile.
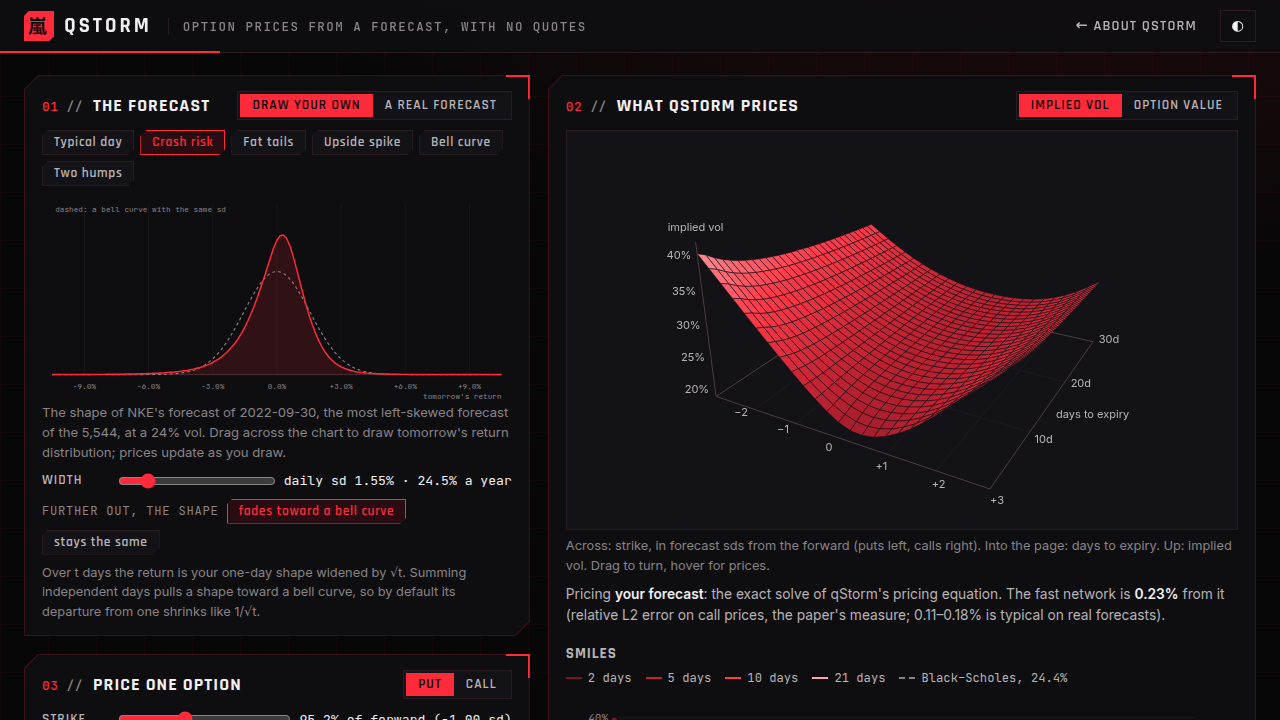
The explorer runs qStorm in your browser. Draw a forecast of tomorrow's return, or pick one qCast really made, and see the implied-vol surface it prices against Black–Scholes, and how an option's value sharpens into its payoff as expiry nears.
Why
Option models are usually calibrated to option quotes: fit a smile to today's prices, then interpolate. That needs quotes, and many options have few or none, such as new listings, illiquid names, far strikes and new expiries. qStorm prices them from what is known about the asset itself, a forecast of its whole return distribution, and so gives a price where there is nothing to calibrate to.
How it works
- A forecast. qCast forecasts the full distribution of an asset's return at horizons from 1 to 42 days.
- A local volatility. If returns really follow the forecast, the asset moves as dS = μS dt + ϱS dW, with ϱ read straight off the forecast's quantile curve. Delta hedging removes the drift and leaves a pricing equation. When returns are Gaussian, ϱ is constant and the equation is exactly Black–Scholes. Otherwise the skew and fat tails of the forecast produce the smile.
- A solver. A finite-difference solve gives every strike and expiry at once. A physics-informed network trained on the equation prices any option in about 200 µs, within 0.11–0.18% of the solve (median). Baked into lookup tables, a price and delta take 6–12 ns.
Results
PreliminaryWork in progress and subject to change: one year of option quotes, with no market crash in the sample. More data is needed for a full evaluation; see below.
Held-out quotes from March to August 2023: 768,329 out-of-the-money quotes and 20,768 smiles on 45 US stocks and ETFs, up to 30 days to expiry.
| Model | Median IV error (vol pts) | Log-price RMSE | W₁ on log prices |
|---|---|---|---|
| Priced from the asset's returns alone, with no option quotes | |||
| qStorm | 2.20 | 0.632 | 0.376 |
| Heston–Nandi, fitted to returns | 3.93 | 1.410 | 0.691 |
| GJR-GARCH-t, fitted to returns | 3.96 | 1.313 | 0.630 |
| Black–Scholes, qCast's vol | 4.14 | 1.389 | 0.629 |
| Black–Scholes, 30-day realised vol | 5.28 | 1.646 | 0.922 |
| Fitted to the same options' quotes from the day before | |||
| Sticky strike | 1.00 | 0.686 | 0.241 |
| XGBoost on yesterday's smile | 1.10 | 0.435 | 0.187 |
| MLP on yesterday's smile | 1.39 | 0.664 | 0.276 |
| Heston, refit every day | 1.46 | 0.656 | 0.243 |
| Neural SDE on yesterday's smile | 1.63 | 0.831 | 0.304 |
Lower is better in every column. Log-price RMSE weighs cheap and expensive options alike; W₁ compares the whole smile's spread of log prices.
Against models that see the quotes
The second group is not a like-for-like comparison. Those models see yesterday's prices of the very options being scored, which is the market's own answer one day earlier, and implied vols move little from one day to the next. qStorm sees no option prices at all, only the asset's past returns, which is why it can price options that have no quotes. Even so, it holds its own on the shape of prices across strikes:
- Log prices. Its log-price error (0.632) is lower than that of sticky strike (0.686), the MLP (0.664) and the neural SDE (0.831), and level with Heston refit to the quotes every day (0.656).
- The far wing. Beyond +4 sd it is 7.52 vol points off, against 8.88 for gradient boosting, 10.77 for daily-refit Heston and 22.13 for the neural SDE.
- Hidden tickers. With a ticker's whole chain hidden, it beats gradient boosting trained on every other ticker's quotes on all three metrics: 2.20 against 2.27 vol points, 0.632 against 0.684 in log prices.
- As a prior. Three quotes plus qStorm rebuild a whole smile to 0.18 vol points, 36% better than the best fit without a forecast. With only three quotes per smile, SVI with qStorm as a prior has the lowest log-price error of all methods (0.563 against 0.716 for SVI alone), and Heston's error falls by 42%.
- Crypto. On 51 monthly snapshots of BTC and ETH options, 10.65 vol points against 16.47–22.01 for the quote-free rivals.
Backtests on simulated markets
qCast simulates joint paths of every asset, re-forecasting along the way, and qStorm marks the options along each path. A backtest on these paths says what a strategy's next quarter could look like, not only what its past did. On 8 stock strategies at 81 monthly origins from 2018 to 2024, the ranges the paths gave for the next 63 days held up against what really happened:
| Share of real outcomes | Ideal | Simulated paths: miss | Historical backtest: miss |
|---|---|---|---|
| Inside the middle half | 50% | 0.9 pts (49.1%) | 13.4 pts (36.6%) |
| Above the 95% quantile | 5% | 2.4 pts (2.6%) | 3.6 pts (8.6%) |
| Below the 5% quantile | 5% | 4.1 pts (9.1%) | 4.6 pts (9.6%) |
| Average miss | 2.5 pts | 7.2 pts |
- Risk forecasts. The paths forecast a strategy's realised vol better than its own historical backtest (CRPS skill +0.12) and better than GARCH paths (+0.22). For long-short books, such as momentum, the gain on vol is +0.32.
- Option overlays. For put-writes, covered calls, protective puts and collars marked by qStorm, the paths' ranges for P&L at expiry are close to calibrated, missing the ideal share by 5.2 points in the middle half, 0.6 above the 95% quantile and 1.6 below the 5%. The historical backtest misses by 4.6 points above its 95%.
- Tuning rules. Exit rules tuned only on the simulated paths capture 74–95% of the achievable gain on real stocks, against 44–90% when tuned on real history. qStorm's marks along the paths set better stops for short straddles than sticky marks do.
Looking for option data
These results rest on one calm year of short-dated US quotes. To test qStorm properly, across regimes, markets and maturities and through stress periods, I am looking for historical option data for academic research. Partial coverage helps: any one of these would make a difference.
- Most needed: US index, ETF and single-stock options, end of day, 2018 to now, with spot, dividends and rates.
- Broader: the same for Europe and Japan, and futures, FX and crypto options.
- Intraday: one-minute quotes on liquid US names, including same-day expiries.
- Exotics and history: traded average-price (Asian) options, and US data back to 2010.
If you supply data and would like your name on the paper, please get in touch at [email protected]. I will happily send the full data request.