qCast
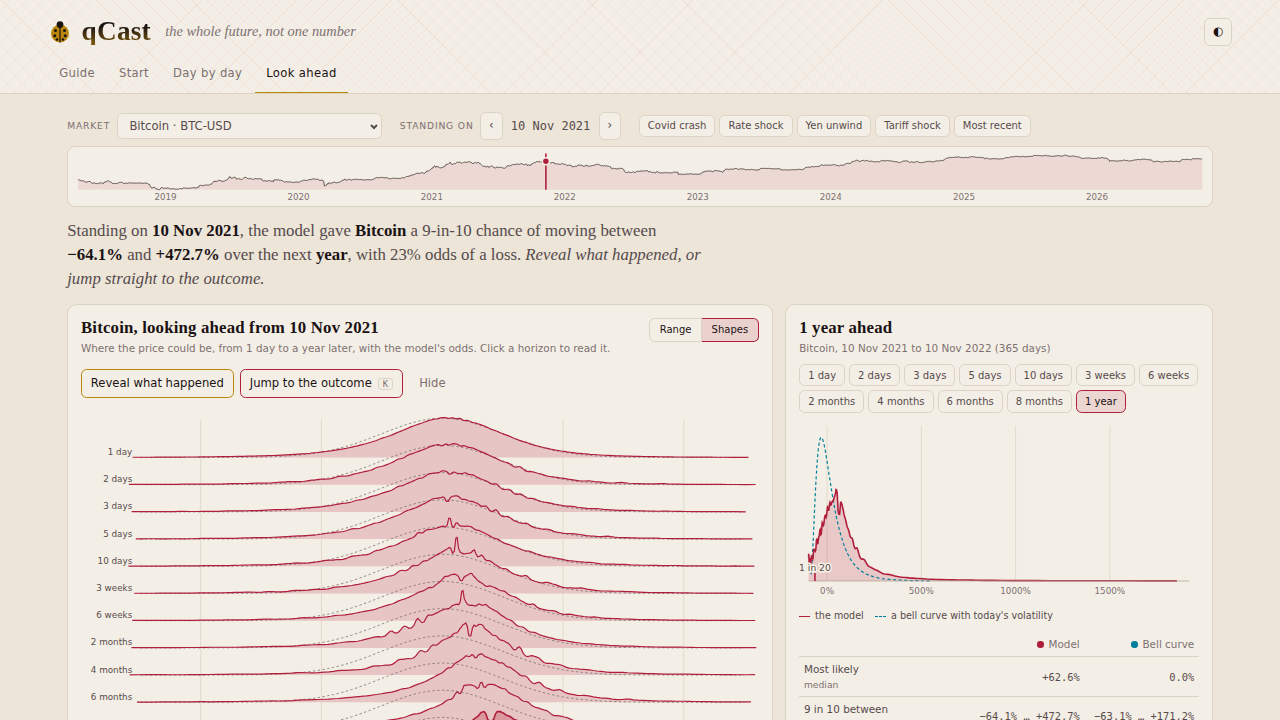
Distribution prediction: forecasts the whole distribution of an asset's future return, not one number, from the next minute to a year ahead, for stocks, ETFs, currencies, futures and crypto.
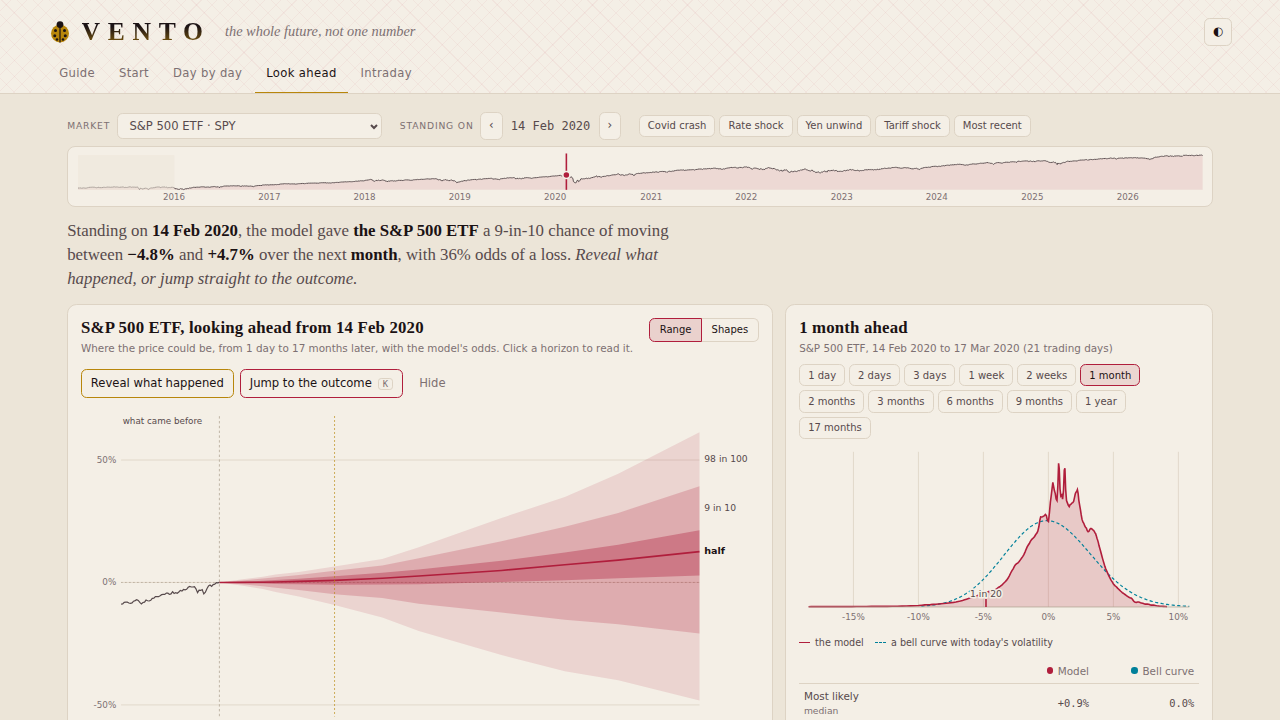
The forecast made on 14 February 2020, a week before the Covid crash. In the explorer, "Reveal what happened" draws the realized path over the fan.
Why a distribution
A point forecast says "the S&P 500 will rise 0.1% tomorrow". For risk, sizing or pricing, what matters is everything else: how likely a 5% drop is, how fat the tails are, whether the odds are skewed. qCast outputs the full conditional law, so value at risk, expected shortfall, odds of a loss and any quantile come from one forecast.
How it works
- One step ahead. A neural network reads an asset's recent returns, volatility and the state of the wider market, and outputs 100 quantiles of the next bar's return. It works in units of each asset's own volatility, so one network serves assets whose volatility differs by a factor of 18, and one generalist covers all five frequencies (1 minute, 15 minutes, 1 hour, 1 day, 1 week).
- Many steps ahead. The one-step law is simulated forward. The network supplies the shape of each shock and today's scale; GJR-GARCH, fitted per asset, supplies how that scale evolves; and a vol-of-vol mixture widens the tails for uncertainty in volatility itself. Validity, anchoring to the one-step forecast and consistency across horizons are proved.
Results
PreliminaryWork in progress and subject to change: these results are from the follow-up paper in preparation, not yet peer reviewed. The original method is in arXiv:2410.23296.
All scoring uses proper scoring rules on quantiles (pinball loss). The design was frozen before the 2025–26 holdout years were opened.
For multi-horizon forecasts (1 day to 1 year), the model is compared on identical pairs with direct horizon-conditioned networks and six benchmarks reimplemented from the literature. Daily data, walk-forward 2018–2024:
| Model | Pinball regret | VaR error, ≤ 1 month |
|---|---|---|
| qCast (GJR hybrid + mixture) | 0.30% | 6.7% |
| qCast without the mixture | 0.05% | 28.7% |
| GJR-GARCH-t, simulated | 1.41% | 27.8% |
| CCQF (Seo et al. 2026) | 2.31% | 31.4% |
| Direct TCN | 3.06% | 19.2% |
| Neural Lévy (Wang and Rachev 2025) | 5.49% | 26.9% |
| DeepAR (Salinas et al. 2020) | 8.84% | 89.2% |
At the daily frequency the model is at or near the best at every horizon and by far the best calibrated, though at year-ahead horizons none of its leads is statistically significant, and the version without the mixture is the sharper pinball forecast. At 1 hour, 15 minutes and 1 week its lead is significant against almost every model. No model is best everywhere: the direct networks lead at 1 minute, and two literature models lead in single holdout cells.
Where it goes next
qCast's forecasts feed qStorm, which prices options from them without calibrating to any option quotes.